Kintex Hybrid Analytics Architecture
Three clear phases to modernize Kintex analytics: run a nightly ETL, explore metrics with Metabase, and deliver a focused dashboard.
Guiding Objectives
- Keep Kintex reporting data in its own store so the EPB ERP stays steady.
- Let teams test KPIs quickly in Metabase before any code work.
- Show long-term trends and live KPIs in one branded dashboard.
Why the Kintex hybrid rollout happens in phases
The hybrid architecture is intentionally sequenced so each stage delivers value on its own and lays the groundwork for the next. By finishing the extract-and-load work first, teams can experiment in Metabase with real data, then promote proven insights into a branded Kintex experience without rework.
Stabilize a nightly ETL from EPB so reporting data lives outside the ERP and history is preserved.
Use low-code exploration to agree on KPIs, iterate quickly, and document the definitions Kintex cares about.
Embed the curated content and custom components to give every team a polished, always-on analytics hub.
Build the pipeline step by step
Finish one stage, learn from it, then move on with the pieces already in place.
Diagram: Nightly ETL flow from EPB to the Kintex analytics store.
Copy EPB ERP data into a Kintex analytics store every night, shaping it for reporting and keeping history intact.
What happens
- Nightly extract and transform jobs
- Cleaned tables built for analysis
- Historical snapshots retained
Why it helps
- ERP stays focused on transactions
- Analytics queries run faster
- Data foundation ready for new Kintex use cases
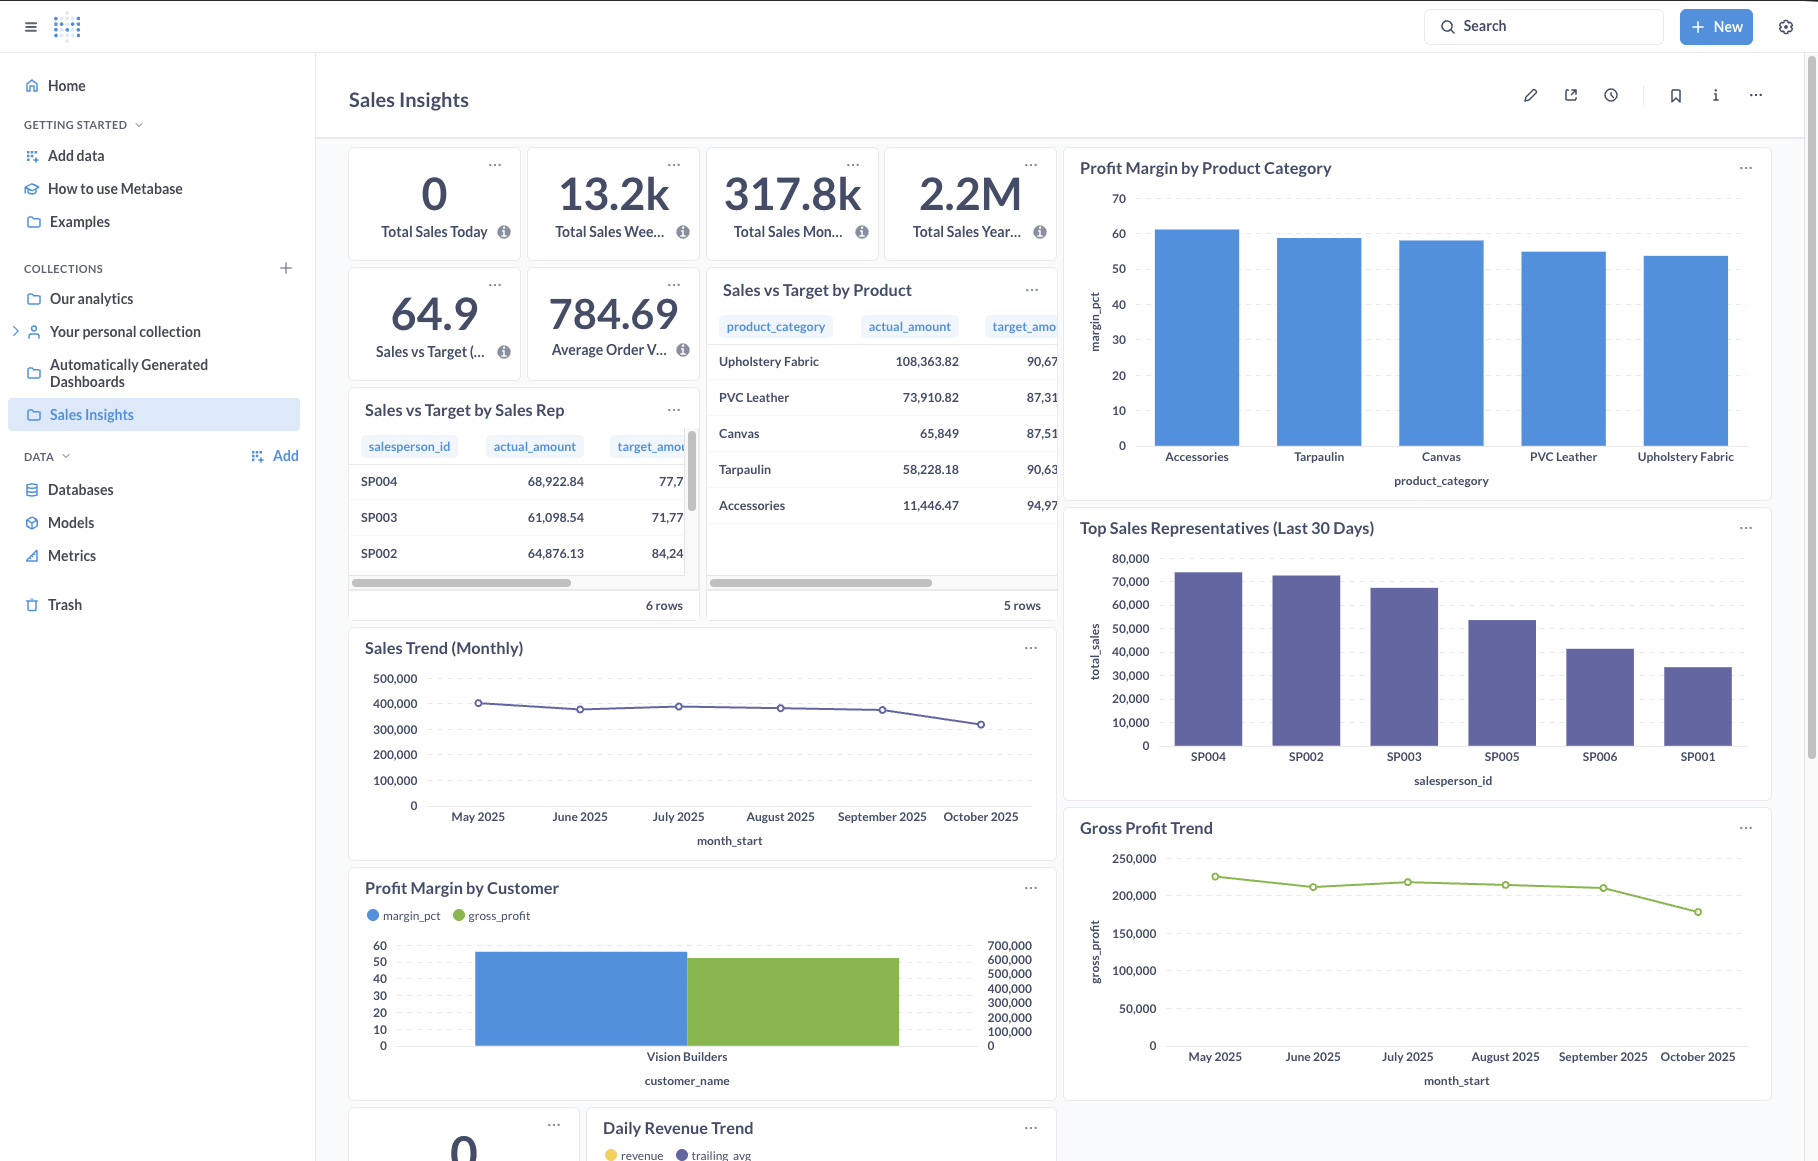
Screenshot: Metabase dashboard sample.
Use Metabase to explore the analytics tables, test KPIs with Kintex stakeholders, and agree on the metrics that matter.
What happens
- Teams build charts without code
- Dashboards shared for feedback
- Metric definitions captured
Why it helps
- Faster iteration on ideas
- Less engineering rework
- Shared understanding of Kintex KPIs
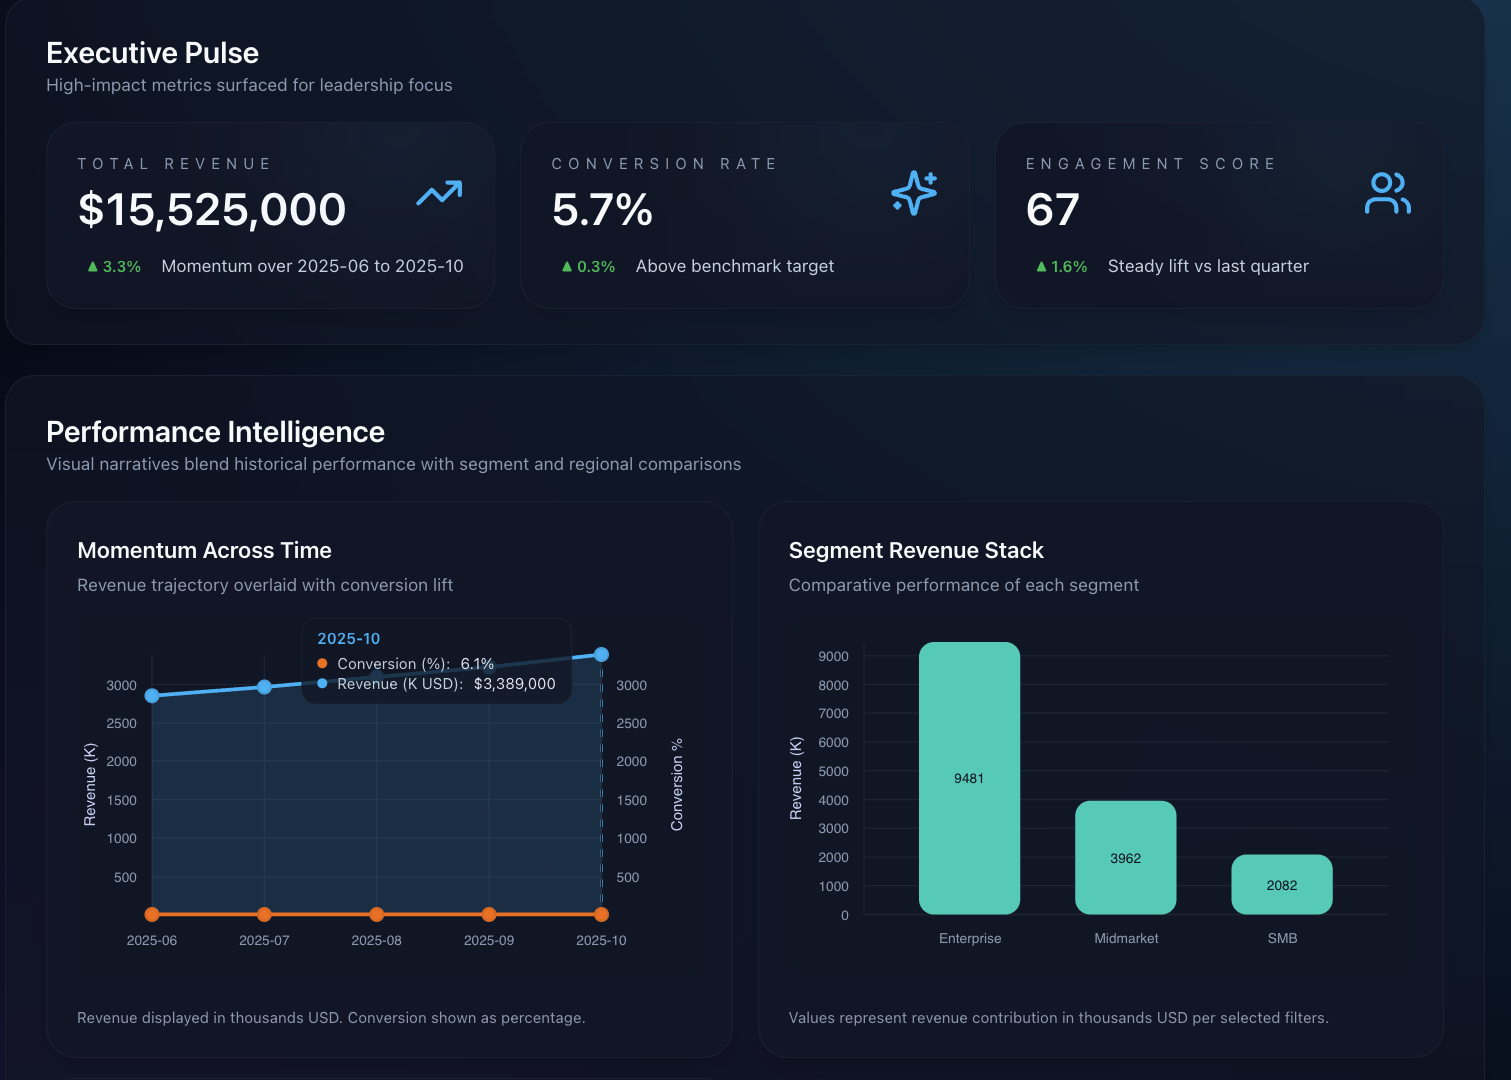
Screenshot: Custom Kintex dashboard concept.
Embed the finalized Metabase content and add custom widgets for live KPIs, Kintex branding, and advanced filters.
What happens
- Embed approved Metabase charts
- Add custom widgets for live KPIs
- Apply Kintex branding and layout rules
Why it helps
- Single pane for Kintex insights
- Supports advanced filters and actions
- Ready for secure embedding upgrades
Data flow at a glance
See how data moves from the EPB ERP into tools that Kintex teams use every day.
EPB Operational DB
Live system that holds sales, inventory, and customer data.
Nightly ETL
Jobs pull, clean, and prepare the data every night.
Kintex Analytics PostgreSQL
Reporting tables ready for queries and dashboards.
Metabase + Kintex UI
Metabase, APIs, and custom pages show the right insight to each team.
Flow from source to dashboard
Follow the path from the EPB ERP database through ETL, Metabase, and Kintex's custom features.
Why the order matters
- ERP stays fast because reporting runs on a different database.
- Metabase helps pick the right KPIs before we build custom code.
- The final dashboard blends long-term trends and live widgets in one place.
Implementation Priorities
Data Readiness
Pick the ETL tool (Laravel Scheduler, Airflow, or cron) and shape analytics tables.
Metric Catalog
Write down KPI definitions as Metabase sessions confirm them with stakeholders.
Experience Layer
Design the dashboard layout that mixes embedded charts and custom widgets.
Key deliverables
ETL Playbook
Nightly sync scripts, job steps, and basic monitoring tips.
Metabase Prototype
Sample dashboards showing agreed KPIs and notes from reviews.
Custom Dashboard Shell
Responsive page ready for embeds and custom widgets.
Adoption Toolkit
Short guides, walkthroughs, and a simple governance checklist.